|
WELCOME TO Quintus Prolog The Industry Standard |
| Quintus Home > Quintus User Interface | |
|
|
WELCOME TO Quintus Prolog The Industry Standard |
| Quintus Home > Quintus User Interface | |
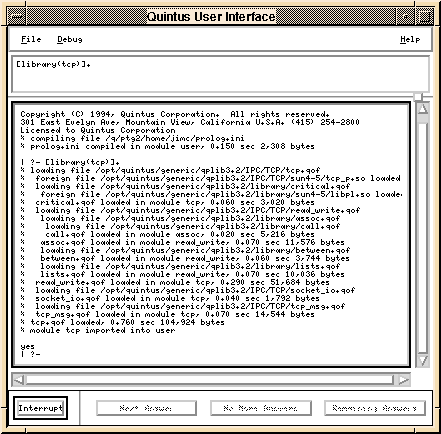
Quintus User Interface (QUI)QUI is Quintus Prolog's graphical development environment for the UNIX platform. It requires the Motif libraries 1.2.x. The user conducts an interactive Prolog session inside the interpreter sub-window of the main QUI window. A history of user commands is saved in a history sub-window. From its pull-down menus, the user may invoke the debugger or the help system, each in their own windows. The 7-port debugger is an extension of Prolog's traditional 4-port model, with additional commands. The help system gives hypertext access to the entire Quintus Prolog manual. Note: the Emacs interface, available on all platforms, offers the same functionality as QUI.
The Quintus User Interface window shows a session that began with loading the TCP library, used for Client/Server programming. After the greeting banner, the interpreter sub-window shows TCP and required additional library QOF files being loaded. The history sub-window contains only the use_module command, at this time. QUI Help
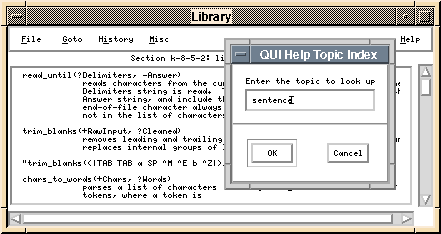
The QUI Help Topic Index window shows the user asking for help on the topic sentence. This window was invoked by the Index... command in the Goto menu of the main help window. The Quintus Prolog Help System window, here titled Library, shows one section of the Quintus Prolog manual that matched the user's query. This section describes predicates in read_sent.pl, one of the files in the Quintus Prolog library. These predicates are used to obtain user input in the form of English (or other language) sentences. The help system itself is invoked from the Help menu of the main Quintus User Interface window. QUI Debugger
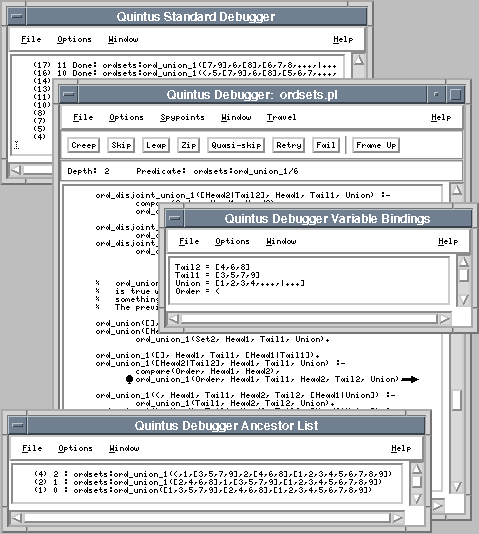
The Quintus Debugger window displays source code being traced. The goal on the third line from the bottom of the window has just been executed. The solid arrow at the end of the line marks a deterministic exit. The small stop-sign at the beginning of the line marks the presence of a spypoint on the goal. The debugger is invoked from the Debug menu of the main QUI window. The Variable Bindings window shows variable bindings in the clause currently being executed. The Ancestor List window displays the current goal on the top line, with its ancestors on following lines. The Standard Debugger window, in the background, shows a trace of the program as it would be seen in the standard, text-oriented development system. |